 English
 Deutsch
 Español
 Français
 Português
 日本
日本
 한국인
한국인
 Türkçe
 Русский
 Tiếng Việt

The big question once a Bitcoin spot ETF is launched in the US, is just how much inflows into ETFs this may prompt? and what impact on price those flows may have? Some good analysis has already been done on the former by Galaxy who surmised that there are US$14.4 trillion addressable assets in the United States. One could assume that perhaps 10% invest in a spot bitcoin ETF with an average allocation of 1%, which would equate to US$14.4 billion of inflows in the first year. If this were correct then it would be the largest inflows on record, with the largest so far being in 2021, which saw US$7.24 billion of inflows, representing 11.5% of assets under management (AuM). On a proportional basis though, 2021 did not see the largest inflows, that was in 2020, where we saw US$5.5 billion of inflows representing a higher 21.6% of AuM. It was also a year where the price rose by 303%, compared to 60% in 2021.
There does seem to be a relationship between inflows as a percentage of AuM and change in price. Inflows do appear to be coincident, the week the prices rise so do flows rather than one leading the other.
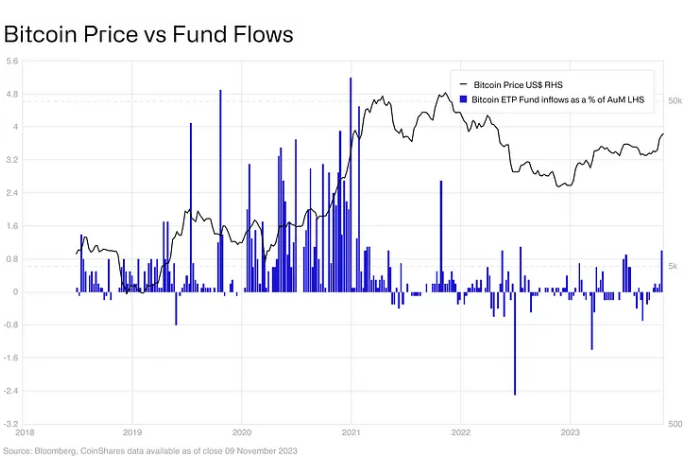
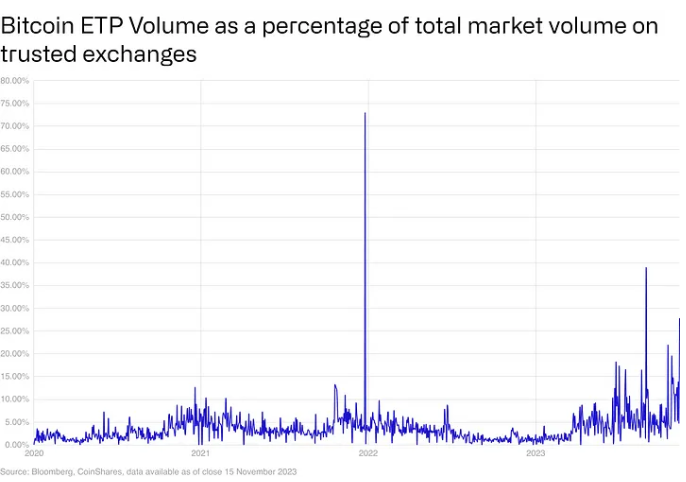
The highest inflows were witnessed when the prices were rising, suggesting many ETP investors are momentum trading. In periods where the price has floundered, the flows have moderated too, early 2019 and 2022 being good examples of this. We do not believe that ETP investors necessarily lead price action too, this is evident in the volumes data, which highlights that ETP volumes have averaged 3.5% of daily bitcoin trading turnover on trusted exchanges, based on data going back to 2018. This year is unusual in the fact that ETP volumes have proportionally risen, this is due to the dramatic fall in volumes from Binance rather than a rise in ETP volumes. Historically at least, as overall market volumes rise, so have ETP volumes, where there is a form of “sentiment matching”.
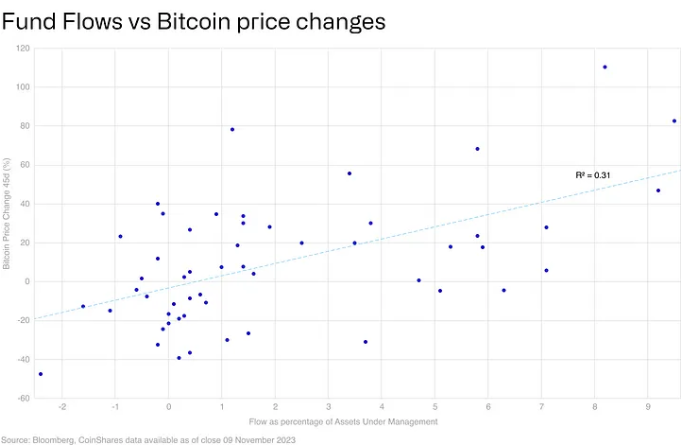
Looking at weekly ETP flows from a quantitative perspective, there is a relationship. Looking at 45 day change in prices and weekly flows as a percentage of AuM, the R2 is 0.31, not perfect by any means but signifies some semblance of a trend does exist.
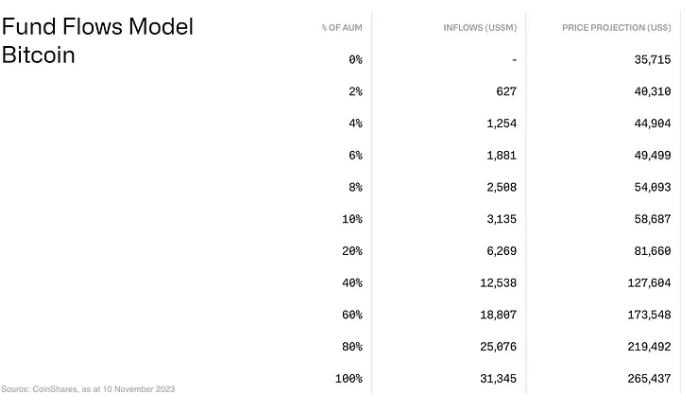
Using this trendline it can help us predict what inflows would have on price. If we take the aforementioned US$14.4 billion of inflows, the model suggests it could push the price up to US$141,000 per Bitcoin. The problem with the estimate of inflows is that it is very difficult to ascertain exactly how much inflows there will be when the spot ETFs are launched. Below is a simple matrix with a varied set of inflows, and its potential impact on the Bitcoin price.
Ultimately, it is very difficult to ascertain just how big the potential wall of demand will be once a spot-based ETF is launched. We know that it effectively diversifies a portfolio and enhances sharpe ratios, as discussed here, but regulatory approval and corporate acceptance are slow burn issues due to Bitcoin’s perceived complexity. For this reason it may well take some time for corporations and funds to build up their knowledge and confidence before they decide to invest.